


User experience (UX) analytics is a crucial aspect of modern web design and development. It provides insights into how users interact with a website or application, allowing designers and developers to make informed decisions that enhance usability and satisfaction. By understanding user behavior, businesses can identify pain points, streamline navigation, and ultimately improve conversion rates. In a digital landscape where competition is fierce, leveraging UX analytics can be the difference between retaining users and losing them to competitors.
Moreover, UX analytics goes beyond just tracking clicks and page views. It encompasses a range of metrics that reveal the motivations and frustrations of users. This deeper understanding helps teams prioritize changes that will have the most significant impact on user satisfaction. In essence, UX analytics is not just about collecting data; it’s about translating that data into actionable insights that lead to better design and improved user experiences.
Key Takeaways
- Understanding the Importance of UX Analytics:
- UX analytics is crucial for understanding user behavior and making informed design decisions.
- It helps in identifying pain points and areas for improvement in the user experience.
- Key Metrics to Track for UX Optimization:
- Metrics like bounce rate, conversion rate, and average session duration are important for measuring UX effectiveness.
- Tracking user engagement, retention, and satisfaction can provide valuable insights for optimization.
- Utilizing Heatmaps and Click Tracking for User Behavior Analysis:
- Heatmaps and click tracking tools help in visualizing user interactions and identifying popular or ignored areas on a webpage.
- They provide valuable data on user behavior and preferences for informed design changes.
- A/B Testing and Multivariate Testing for UX Improvement:
- A/B testing and multivariate testing are essential for comparing different design variations and determining the most effective one.
- They help in optimizing UX elements for better user engagement and conversion rates.
- Incorporating User Surveys and Feedback for Insightful Data:
- User surveys and feedback collection provide direct insights into user preferences, pain points, and satisfaction levels.
- They offer qualitative data that complements quantitative analytics for a comprehensive understanding of user needs.
Key Metrics to Track for UX Optimization
When it comes to optimizing user experience, there are several key metrics that should be on your radar. First and foremost is the bounce rate, which indicates the percentage of visitors who leave a site after viewing only one page. A high bounce rate can signal that users aren’t finding what they expect or that the content isn’t engaging enough. Tracking this metric can help identify areas for improvement, such as enhancing content relevance or improving page load times.
Another important metric is the average session duration, which measures how long users stay on your site. Longer sessions typically indicate that users are engaged with your content. If you notice a decline in this metric, it may be time to reassess your content strategy or navigation structure. Additionally, tracking conversion rates—whether that’s signing up for a newsletter, making a purchase, or filling out a contact form—provides direct insight into how well your site meets user needs and expectations.
Utilizing Heatmaps and Click Tracking for User Behavior Analysis
Heatmaps and click tracking tools are invaluable for visualizing user behavior on your site. Heatmaps provide a graphical representation of where users click, scroll, and hover, allowing you to see which areas of your site attract the most attention. This information can help you understand what elements are working well and which ones may need adjustment. For instance, if a call-to-action button isn’t receiving clicks, it might be worth experimenting with its placement or design.
Click tracking takes this a step further by providing detailed data on user interactions. By analyzing click patterns, you can identify navigation issues or content that isn’t resonating with your audience. For example, if users are consistently clicking on an image expecting it to lead to more information but it doesn’t, this could indicate a missed opportunity for engagement. Together, heatmaps and click tracking offer a comprehensive view of user behavior that can inform design decisions and enhance overall UX.
A/B Testing and Multivariate Testing for UX Improvement

A/B testing is a powerful method for optimizing user experience by comparing two versions of a webpage or app to see which performs better. By changing one element at a time—such as the color of a button or the wording of a headline—you can gather data on user preferences and behaviors. This approach allows you to make data-driven decisions rather than relying on assumptions about what users want.
Multivariate testing takes A/B testing a step further by allowing you to test multiple variables simultaneously. This method can provide deeper insights into how different elements interact with each other and affect user behavior. For example, you might test various combinations of headlines, images, and calls-to-action to determine which combination yields the highest conversion rate. While multivariate testing can be more complex to set up and analyze, it can lead to more nuanced insights that significantly enhance user experience.
Incorporating User Surveys and Feedback for Insightful Data
| Metric | Description |
|---|---|
| Conversion Rate | The percentage of users who take a desired action on a website or app |
| Bounce Rate | The percentage of visitors who navigate away from the site after viewing only one page |
| User Engagement | Measure of how users interact with a website or app, including time spent, pages visited, and actions taken |
| Heatmaps | Visual representation of user interactions with a website, showing where users click, move, and scroll |
| User Feedback | Qualitative data gathered from users through surveys, interviews, or feedback forms |
While analytics tools provide valuable quantitative data, qualitative insights from user surveys and feedback are equally important. Surveys allow you to gather direct input from users about their experiences, preferences, and pain points. By asking targeted questions, you can uncover specific issues that may not be evident through analytics alone. For instance, if users report difficulty finding information on your site, this feedback can guide you in making necessary adjustments.
In addition to surveys, consider implementing feedback forms or pop-up prompts that encourage users to share their thoughts while they’re actively engaged with your site. This real-time feedback can provide immediate insights into user satisfaction and areas for improvement. By combining quantitative data from analytics with qualitative insights from user feedback, you can create a more holistic understanding of the user experience.
The Role of Google Analytics in UX Optimization
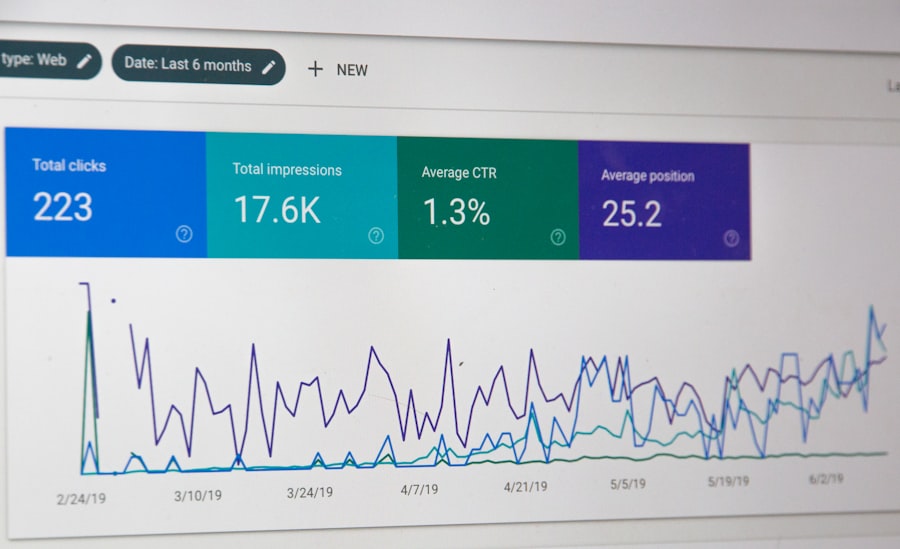
Google Analytics is one of the most widely used tools for tracking website performance and user behavior. It offers a wealth of data that can inform UX optimization efforts. From tracking page views and bounce rates to monitoring user demographics and acquisition channels, Google Analytics provides a comprehensive overview of how users interact with your site.
One of the standout features of Google Analytics is its ability to set up goals and track conversions. By defining specific actions you want users to take—such as completing a purchase or signing up for a newsletter—you can measure how effectively your site drives these actions. Additionally, Google Analytics allows you to segment data by various criteria, such as device type or traffic source, enabling you to tailor your UX strategies based on different user groups.
Leveraging Session Recording for In-Depth User Interaction Analysis
Session recording tools offer an in-depth look at how individual users navigate your site. By recording user sessions, you can observe real-time interactions, including mouse movements, clicks, and scrolling behavior. This level of detail can reveal valuable insights into user frustrations or confusion points that may not be captured through traditional analytics.
For example, if you notice that users frequently pause or hesitate on certain pages, it may indicate that they’re struggling to find information or understand the layout. By analyzing these recordings, you can identify specific areas for improvement—whether it’s simplifying navigation or enhancing content clarity. Session recordings provide a unique opportunity to step into the shoes of your users and gain a deeper understanding of their experiences.
Implementing Conversion Funnel Analysis for UX Enhancement
Conversion funnel analysis is essential for understanding how users move through your site toward completing desired actions. By mapping out each step in the conversion process—from landing on the homepage to finalizing a purchase—you can identify where users drop off and why. This analysis helps pinpoint specific barriers that may be hindering conversions.
For instance, if you notice a significant drop-off at the checkout page, it may indicate issues with the payment process or lack of trust signals. By addressing these concerns—such as simplifying forms or adding security badges—you can enhance the overall user experience and increase conversion rates. Conversion funnel analysis not only highlights problem areas but also provides a roadmap for optimizing each stage of the user journey.
Using Cohort Analysis to Understand User Retention and Engagement
Cohort analysis is a powerful technique for examining user retention and engagement over time. By grouping users based on shared characteristics—such as the date they signed up or their first purchase—you can track their behavior and interactions with your site over specific periods. This analysis helps identify trends in user engagement and retention rates.
For example, if you notice that users who signed up during a particular marketing campaign have higher retention rates than those who signed up at another time, it may indicate the effectiveness of that campaign in attracting engaged users. Understanding these patterns allows you to tailor your marketing strategies and improve overall user experience by focusing on what resonates with your audience.
The Impact of Mobile Analytics on UX Design
With an increasing number of users accessing websites via mobile devices, mobile analytics has become essential for UX design. Mobile analytics tools provide insights into how users interact with your site on smartphones and tablets, highlighting differences in behavior compared to desktop users. This information is crucial for optimizing mobile experiences.
For instance, if mobile users have a higher bounce rate than desktop users, it may indicate issues with mobile responsiveness or navigation challenges specific to smaller screens.
By analyzing mobile-specific metrics—such as touch interactions and screen orientation—you can make informed design decisions that enhance usability across devices.
Prioritizing mobile analytics ensures that your UX design caters effectively to all users.
Best Practices for Using Analytics to Inform UX Design Decisions
To effectively leverage analytics for UX design decisions, it’s important to follow best practices that ensure data-driven insights lead to meaningful improvements. First, establish clear goals for what you want to achieve with your UX efforts—whether it’s increasing conversions or enhancing user satisfaction.
Next, regularly review and analyze your data rather than waiting for periodic reports.
Continuous monitoring allows you to spot trends early and make timely adjustments based on real-time insights.
Additionally, involve cross-functional teams in the analysis process; collaboration between designers, developers, marketers, and product managers can lead to more comprehensive solutions.
Finally, remember that analytics should inform—not dictate—your design decisions. Use data as a guide while also considering qualitative insights from user feedback and testing results. Balancing quantitative data with qualitative understanding will lead to more effective UX improvements that resonate with your audience.
In conclusion, utilizing UX analytics is essential for creating effective digital experiences that meet user needs and drive business success. By tracking key metrics, employing various analytical tools, and incorporating user feedback into your design process, you can continuously refine your approach and enhance overall user satisfaction.
FAQs
What is the role of analytics in UX design?
Analytics in UX design involves using data to understand user behavior, preferences, and interactions with a product or website. This data helps designers make informed decisions to improve the user experience.
What are some common analytics tools used by UX designers?
Some common analytics tools used by UX designers include Google Analytics, Hotjar, Crazy Egg, and Mixpanel. These tools provide insights into user behavior, such as click patterns, heatmaps, and user flow.
How do UX designers use analytics to improve user experience?
UX designers use analytics to identify pain points in the user journey, understand user preferences, and measure the effectiveness of design changes. This data-driven approach helps designers make informed decisions to improve the overall user experience.
What are some key metrics that UX designers track using analytics?
Key metrics that UX designers track using analytics include bounce rate, conversion rate, time on page, click-through rate, and user engagement. These metrics provide valuable insights into user behavior and the effectiveness of design changes.
How can analytics help UX designers make data-driven design decisions?
Analytics help UX designers make data-driven design decisions by providing insights into user behavior, preferences, and pain points. By analyzing this data, designers can identify areas for improvement and make informed decisions to enhance the user experience.


0 Comments