


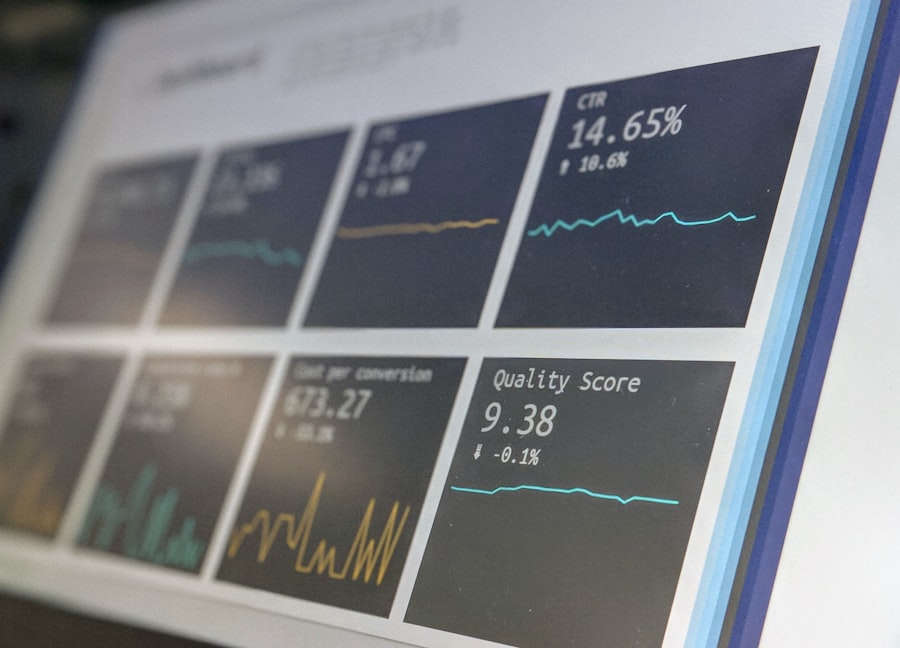
In the contemporary retail landscape, the Store Analytics Dashboard has emerged as a vital tool for businesses seeking to enhance their operational efficiency and drive sales growth. This digital interface consolidates various data points into a single view, allowing retailers to monitor performance metrics in real-time. By integrating data from sales transactions, customer interactions, and inventory levels, the dashboard provides a comprehensive overview of store performance. Retailers can leverage this information to make informed decisions, optimize processes, and ultimately improve profitability.
The significance of a Store Analytics Dashboard extends beyond mere data collection; it serves as a strategic asset that empowers retailers to respond swiftly to market changes. With the ability to visualize complex data sets, businesses can identify trends and patterns that may not be immediately apparent. This capability is particularly crucial in an environment where consumer preferences shift rapidly, and competition is fierce. By utilizing a Store Analytics Dashboard, retailers can gain a competitive edge through data-driven insights that inform their strategies.
Key Takeaways
- Store analytics dashboards provide essential insights to optimize sales and operations.
- Tracking key metrics and visualizing data helps identify customer trends and improve decision-making.
- Predictive analytics enables accurate sales forecasting and better inventory management.
- Data-driven insights enhance marketing strategies and personalize customer experiences.
- Integrating analytics with sales performance management maximizes overall store effectiveness.
Understanding the Importance of Store Analytics
Store analytics plays a critical role in modern retail operations by providing insights that drive decision-making processes. The importance of these analytics lies in their ability to transform raw data into actionable intelligence. Retailers can analyze sales figures, customer demographics, and inventory turnover rates to understand what drives their business. This understanding enables them to tailor their offerings and marketing strategies to better meet customer needs.
Moreover, store analytics fosters a culture of continuous improvement within organizations. By regularly reviewing performance metrics, retailers can identify areas for enhancement and implement changes accordingly. This iterative process not only helps in optimizing sales but also contributes to overall operational efficiency. As businesses become more adept at utilizing analytics, they can anticipate market trends and adjust their strategies proactively, rather than reactively.
Key Metrics to Track for Sales Optimization
To effectively optimize sales, retailers must focus on several key metrics that provide insight into their performance. One of the most critical metrics is sales per square foot, which measures the revenue generated for every square foot of retail space. This metric helps retailers assess the efficiency of their store layout and product placement. By analyzing this data, businesses can make informed decisions about inventory management and merchandising strategies.
Another important metric is conversion rate, which indicates the percentage of visitors who make a purchase.
A low conversion rate may signal issues with product appeal or customer engagement.
By tracking this metric alongside customer feedback, retailers can identify barriers to purchase and implement strategies to enhance the shopping experience. Additionally, monitoring average transaction value (ATV) allows retailers to understand customer spending behavior and develop targeted promotions to increase sales.
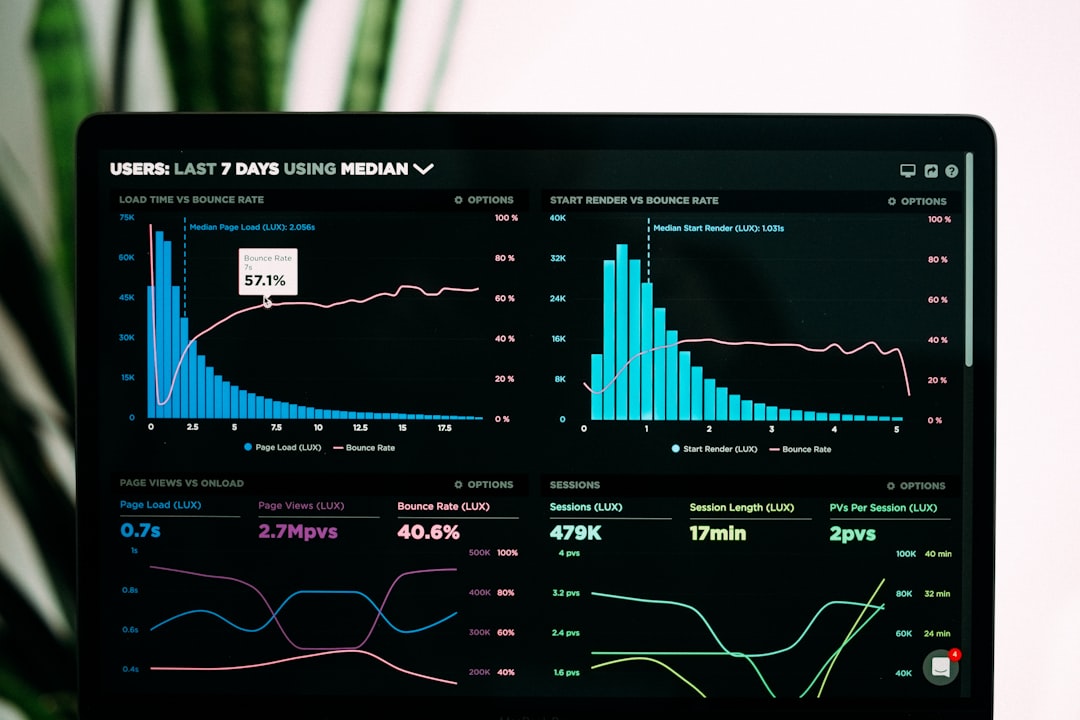
Utilizing Data Visualization for Better Insights

Data visualization is a powerful tool that enhances the effectiveness of store analytics by presenting complex information in an easily digestible format. Through charts, graphs, and dashboards, retailers can quickly grasp trends and patterns that might otherwise be overlooked in raw data. Effective data visualization enables stakeholders to make informed decisions based on clear visual representations of performance metrics.
Furthermore, visual tools can facilitate collaboration among team members by providing a common platform for discussing insights and strategies. When data is presented visually, it becomes easier for different departments—such as marketing, sales, and inventory management—to align their efforts toward common goals.
This collaborative approach fosters a data-driven culture within the organization, encouraging all employees to engage with analytics and contribute to strategic discussions.
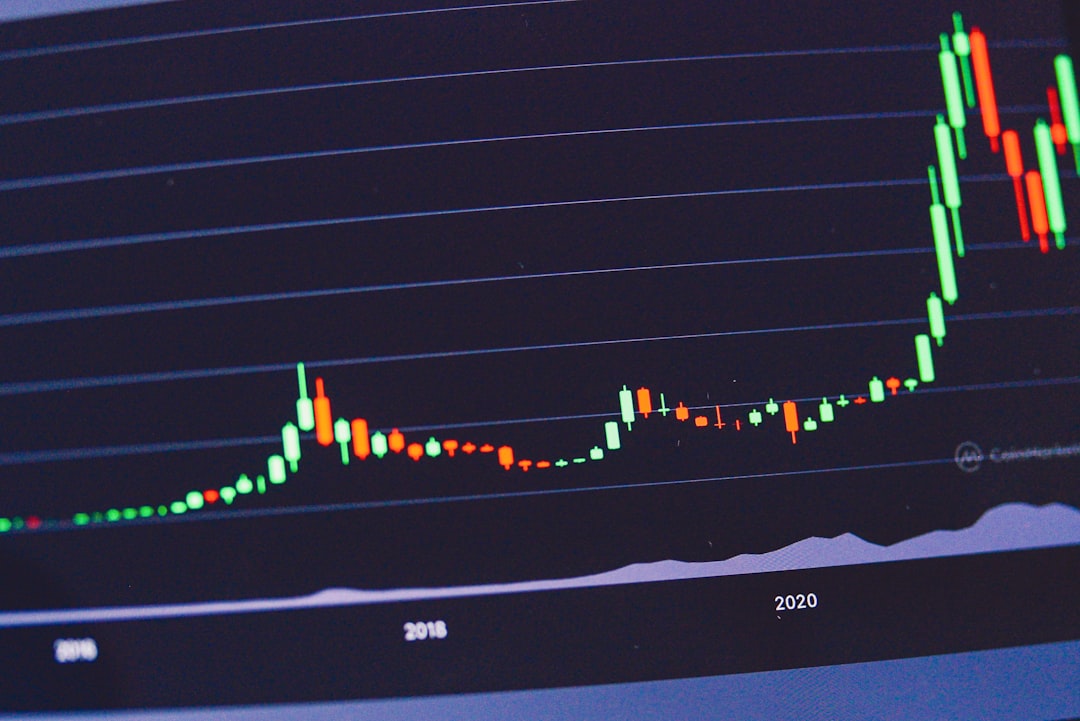
Implementing Predictive Analytics for Sales Forecasting
| Metric | Current Value | Change (Last 30 Days) | Target |
|---|---|---|---|
| Daily Visitors | 1,250 | +8% | 1,500 |
| Conversion Rate | 3.5% | +0.4% | 4.0% |
| Average Order Value | 45.20 | +2.1% | 50.00 |
| Cart Abandonment Rate | 62% | -3% | 55% |
| Revenue | 56,300 | +10% | 60,000 |
| New Customers | 320 | +5% | 400 |
| Returning Customers | 450 | +7% | 500 |
Predictive analytics represents a significant advancement in the realm of store analytics, allowing retailers to forecast future sales based on historical data and trends. By employing statistical algorithms and machine learning techniques, businesses can identify patterns that inform their sales predictions. This capability is particularly valuable for inventory management and resource allocation, as it enables retailers to anticipate demand fluctuations.
Implementing predictive analytics requires a robust data infrastructure that can handle large volumes of information from various sources. Retailers must ensure that their data is clean and accurate to derive meaningful insights from predictive models. Once established, these models can provide forecasts that help businesses prepare for seasonal variations, promotional events, or shifts in consumer behavior. By leveraging predictive analytics, retailers can optimize their operations and enhance customer satisfaction through better product availability.
Identifying Customer Trends and Behavior
Understanding customer trends and behavior is essential for retailers aiming to tailor their offerings effectively. Store analytics provides valuable insights into purchasing patterns, preferences, and demographics. By analyzing this data, businesses can segment their customer base and develop targeted marketing strategies that resonate with specific groups.
For instance, tracking customer purchase history can reveal seasonal trends or popular product categories among different demographics. Retailers can use this information to create personalized promotions or product bundles that cater to individual preferences. Additionally, monitoring customer feedback through surveys or social media interactions allows businesses to gauge sentiment and adjust their strategies accordingly. By staying attuned to customer behavior, retailers can foster loyalty and drive repeat business.
Improving Inventory Management with Analytics
Effective inventory management is crucial for maintaining operational efficiency and meeting customer demand. Store analytics provides retailers with insights into inventory turnover rates, stock levels, and sales velocity. By analyzing this data, businesses can optimize their inventory levels to reduce carrying costs while ensuring product availability.
One key aspect of inventory management is understanding which products are selling well and which are not. Retailers can use analytics to identify slow-moving items and make informed decisions about markdowns or promotions to clear excess stock. Conversely, by recognizing high-demand products, businesses can adjust their purchasing strategies to avoid stockouts during peak periods. This proactive approach not only enhances customer satisfaction but also contributes to improved cash flow.
Enhancing Marketing Strategies with Data-driven Insights
Data-driven insights are instrumental in shaping effective marketing strategies for retailers. By analyzing customer demographics and purchasing behavior, businesses can create targeted campaigns that resonate with their audience. Store analytics enables retailers to segment their customer base based on various criteria such as age, location, or buying habits.
Moreover, tracking the performance of marketing campaigns through analytics allows retailers to assess the return on investment (ROI) of their efforts. By measuring metrics such as conversion rates and customer engagement levels, businesses can refine their marketing strategies over time. This iterative process ensures that resources are allocated effectively and that marketing initiatives align with customer preferences.
Leveraging Store Analytics for Personalized Customer Experiences
Personalization has become a key differentiator in the retail industry, and store analytics plays a crucial role in delivering tailored experiences to customers. By leveraging data on individual preferences and purchase history, retailers can create personalized recommendations that enhance the shopping experience. This approach not only increases customer satisfaction but also drives sales through targeted upselling and cross-selling opportunities.
Additionally, personalized communication strategies—such as tailored email campaigns or loyalty program offers—can be developed using insights from store analytics. By understanding what resonates with different customer segments, retailers can foster deeper connections with their audience. This level of personalization encourages brand loyalty and increases the likelihood of repeat purchases.
Integrating Store Analytics with Sales Performance Management
Integrating store analytics with sales performance management systems allows retailers to align their operational strategies with overall business objectives. By combining sales data with performance metrics such as employee productivity or customer satisfaction scores, businesses can gain a holistic view of their operations.
This integration facilitates more effective decision-making by providing managers with real-time insights into performance across various departments. For example, if sales are declining in a particular store location, managers can quickly analyze related metrics—such as employee engagement or inventory levels—to identify potential issues and implement corrective actions. This comprehensive approach ensures that all aspects of the business are working in harmony toward common goals.
Best Practices for Utilizing Store Analytics Dashboard
To maximize the benefits of a Store Analytics Dashboard, retailers should adhere to several best practices. First and foremost, it is essential to ensure data accuracy by regularly auditing data sources and maintaining clean datasets. Inaccurate data can lead to misguided decisions that negatively impact business performance.
Additionally, training employees on how to effectively use the dashboard is crucial for fostering a data-driven culture within the organization. Providing ongoing education on interpreting analytics will empower team members at all levels to engage with data meaningfully. Finally, setting clear objectives for what insights are needed from the dashboard will help focus efforts on tracking relevant metrics that align with business goals.
In conclusion, the Store Analytics Dashboard serves as an indispensable tool for modern retailers seeking to optimize operations and enhance customer experiences. By understanding its importance and implementing best practices for its use, businesses can leverage data-driven insights to navigate the complexities of the retail landscape effectively.
FAQs
What is a store analytics dashboard?
A store analytics dashboard is a digital tool that consolidates and visualizes key performance metrics related to retail store operations, such as sales data, customer behavior, inventory levels, and employee performance, to help store managers make informed decisions.
What types of data are typically displayed on a store analytics dashboard?
Common data displayed includes sales figures, foot traffic, conversion rates, average transaction value, inventory status, customer demographics, and employee productivity metrics.
How can a store analytics dashboard benefit retail businesses?
It helps businesses monitor performance in real-time, identify trends, optimize inventory management, improve customer experience, and make data-driven decisions to increase sales and operational efficiency.
Is a store analytics dashboard customizable?
Yes, most store analytics dashboards allow customization to focus on specific metrics relevant to the business, enabling users to tailor the dashboard to their unique operational needs and goals.
What technologies are used to create store analytics dashboards?
Store analytics dashboards are typically built using data visualization software and business intelligence tools that integrate with point-of-sale systems, customer relationship management (CRM) platforms, and other data sources to provide comprehensive insights.


0 Comments