


Content engagement metrics are essential for gauging how well your audience interacts with your content. These metrics provide insights into user behavior, helping you understand what resonates with your audience and what doesn’t. Common metrics include page views, time spent on a page, bounce rates, and social shares. By analyzing these figures, you can get a clearer picture of how effectively your content is engaging users.
Engagement metrics go beyond just numbers; they tell a story about your audience’s preferences and interests. For instance, a high bounce rate might indicate that visitors are not finding what they expected, while a longer time on page suggests that users are genuinely interested in the content. Understanding these nuances can help you tailor your content strategy to better meet the needs of your audience.
Key Takeaways
- Understanding Content Engagement Metrics:
- Content engagement metrics measure how users interact with your content, such as time spent on page, bounce rate, and social shares.
- These metrics help you understand how well your content resonates with your audience and can guide your content strategy.
- Utilizing Analytics Tools for Content Engagement:
- Analytics tools like Google Analytics and Adobe Analytics provide valuable insights into content engagement metrics.
- These tools can help you track user behavior, identify trends, and measure the impact of your content.
- Identifying Key Performance Indicators for Content Engagement:
- Key performance indicators (KPIs) for content engagement may include average time on page, conversion rate, and scroll depth.
- By focusing on these KPIs, you can assess the effectiveness of your content and make data-driven decisions.
- Analyzing User Behavior to Improve Content Engagement:
- Understanding how users navigate and interact with your content can help you optimize for better engagement.
- Analyzing user behavior can reveal opportunities to improve content layout, readability, and call-to-action placement.
- Leveraging A/B Testing for Content Engagement Optimization:
- A/B testing allows you to compare different versions of content to see which performs better in terms of engagement.
- By testing elements like headlines, images, and CTAs, you can refine your content for maximum engagement.
Utilizing Analytics Tools for Content Engagement
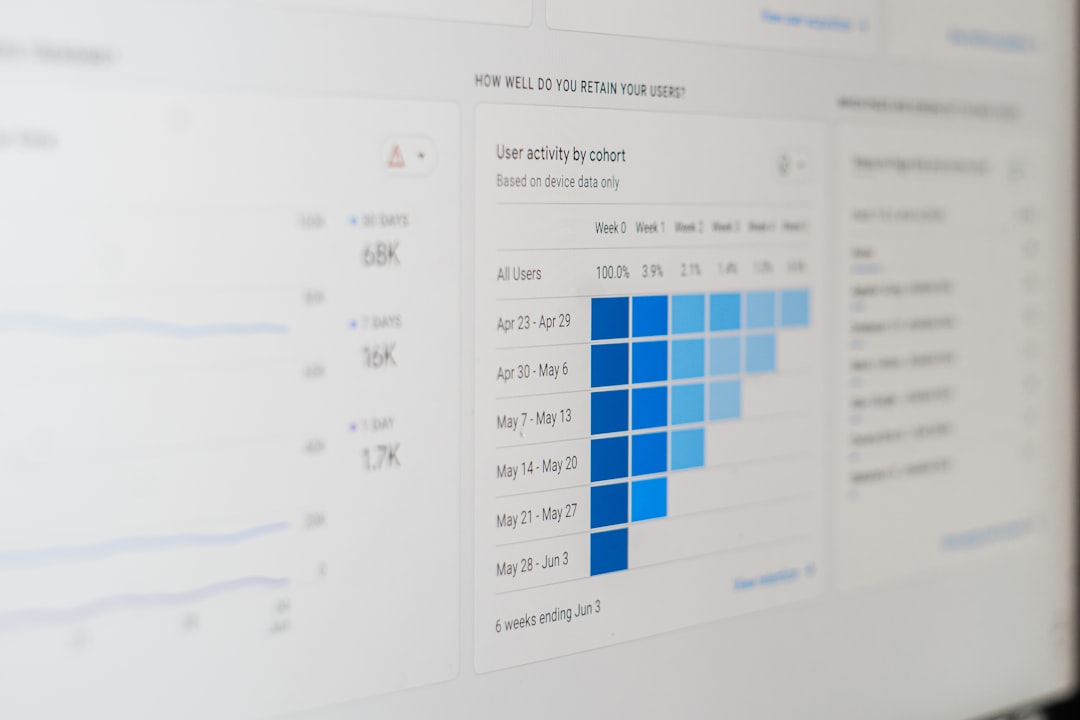
To effectively track and analyze content engagement, leveraging analytics tools is crucial. Google Analytics is one of the most popular options, offering a wealth of data on user interactions. It allows you to monitor traffic sources, user demographics, and behavior flow, giving you a comprehensive view of how users engage with your content.
Beyond Google Analytics, there are other tools like Hotjar and Crazy Egg that provide heatmaps and session recordings. These tools can visually illustrate how users navigate your site, highlighting areas where they click most often or where they lose interest. By combining these insights with traditional analytics data, you can create a more holistic understanding of user engagement.
Identifying Key Performance Indicators for Content Engagement

Key Performance Indicators (KPIs) are vital for measuring the success of your content engagement efforts. Identifying the right KPIs helps you focus on what truly matters for your business goals. Some common KPIs include conversion rates, social media shares, and comments or interactions on blog posts.
When selecting KPIs, consider your specific objectives. If your goal is to increase brand awareness, tracking social shares and reach might be more relevant than conversion rates. On the other hand, if you’re focused on driving sales, monitoring conversion rates and lead generation metrics will be crucial. Tailoring your KPIs to align with your goals ensures that you’re measuring the right aspects of engagement.
Analyzing User Behavior to Improve Content Engagement

Understanding user behavior is key to enhancing content engagement. By analyzing how users interact with your content, you can identify patterns and preferences that inform future strategies.
For example, if you notice that users tend to drop off after a certain point in a video or article, it may indicate that the content is too long or not engaging enough.
Tools like Google Analytics can help you track user behavior metrics such as scroll depth and click-through rates. These insights allow you to pinpoint which sections of your content are most engaging and which may need improvement. By continuously analyzing user behavior, you can refine your content strategy to better capture and retain audience interest.
Leveraging A/B Testing for Content Engagement Optimization
“`html
| Content | Views | Likes | Comments |
|---|---|---|---|
| Blog Post 1 | 1000 | 300 | 50 |
| Video 1 | 5000 | 1000 | 200 |
| Infographic 1 | 2000 | 400 | 100 |
“`
A/B testing is a powerful method for optimizing content engagement. This technique involves creating two versions of a piece of content—Version A and Version B—and comparing their performance to see which one resonates more with your audience. You can test various elements such as headlines, images, call-to-action buttons, or even the overall layout.
The beauty of A/B testing lies in its ability to provide concrete data on what works best for your audience. For instance, if one headline generates significantly more clicks than another, you can confidently use that headline in future content. Regularly conducting A/B tests allows you to make data-driven decisions that enhance engagement over time.
Measuring the Impact of Visual Content on Engagement
Visual content plays a significant role in capturing attention and driving engagement.
Images, infographics, videos, and other visual elements can enhance the overall user experience and make information more digestible.
Measuring the impact of these visuals on engagement is essential for understanding their effectiveness.
You can track metrics such as video views, image shares, and time spent on pages with visual content compared to text-only pages. If you find that visual content consistently outperforms text in terms of engagement, it may be worth investing more resources into creating high-quality visuals. Additionally, consider experimenting with different types of visuals to see which formats resonate best with your audience.
Tracking Social Media Engagement with Analytics
Social media platforms offer unique opportunities for engaging with audiences, making it essential to track social media engagement metrics. Each platform has its own set of analytics tools that provide insights into post performance, audience demographics, and engagement rates.
For example, Facebook Insights allows you to see how many people engaged with your posts through likes, shares, and comments. Similarly, Twitter Analytics provides data on tweet impressions and engagement rates. By analyzing these metrics, you can determine which types of content perform best on social media and adjust your strategy accordingly.
Optimizing Content for Mobile Engagement
With an increasing number of users accessing content via mobile devices, optimizing for mobile engagement is crucial. Mobile optimization involves ensuring that your content is easily accessible and visually appealing on smaller screens. This includes responsive design, fast loading times, and concise text.
You can measure mobile engagement through metrics like mobile bounce rates and time spent on mobile pages compared to desktop versions. If you notice higher bounce rates on mobile devices, it may indicate that your site isn’t optimized for mobile viewing. Making necessary adjustments can significantly enhance user experience and increase engagement across all devices.
Using Data to Personalize Content for Better Engagement
Personalization is a powerful strategy for improving content engagement. By using data to tailor content to individual preferences and behaviors, you can create a more relevant experience for users. This could involve segmenting your audience based on demographics or past interactions and delivering targeted content accordingly.
For instance, if a user frequently engages with articles about technology trends, sending them personalized recommendations or newsletters featuring similar topics can keep them engaged. Utilizing tools like email marketing platforms that offer segmentation features can help streamline this process and ensure that users receive content that aligns with their interests.
Implementing Strategies to Increase Time-on-Page
Increasing time-on-page is a key indicator of content engagement. When users spend more time on a page, it often signifies that they find the content valuable or interesting. To boost this metric, consider implementing strategies such as incorporating multimedia elements like videos or infographics that encourage users to stay longer.
Another effective approach is to use internal linking within your content. By linking to related articles or resources within your site, you can guide users to explore more of your content rather than leaving after reading just one piece. This not only increases time-on-page but also enhances overall site engagement.
Monitoring and Adjusting Content Engagement Strategies with Analytics
Finally, monitoring and adjusting your content engagement strategies based on analytics is crucial for ongoing success. Regularly reviewing performance metrics allows you to identify trends and areas for improvement. If certain types of content consistently underperform, it may be time to rethink your approach or explore new topics.
Analytics should be viewed as an ongoing process rather than a one-time task. Set aside regular intervals—such as monthly or quarterly—to review your metrics and adjust strategies accordingly. This proactive approach ensures that you remain responsive to audience needs and preferences, ultimately leading to improved engagement over time.
In conclusion, understanding and optimizing content engagement requires a multifaceted approach that combines analytics tools, user behavior analysis, A/B testing, and personalization strategies. By focusing on these areas and continuously monitoring performance metrics, you can create engaging content that resonates with your audience and drives meaningful interactions.
FAQs
What are content engagement analytics?
Content engagement analytics are tools and metrics used to measure how users interact with online content, such as web pages, blog posts, and social media posts. These analytics provide insights into user behavior, such as page views, time spent on page, and social shares.
Why are content engagement analytics important?
Content engagement analytics are important because they help businesses and content creators understand how their audience is interacting with their content. By analyzing these metrics, they can make data-driven decisions to improve their content strategy, increase user engagement, and ultimately drive business results.
What are some common metrics used in content engagement analytics?
Common metrics used in content engagement analytics include page views, bounce rate, time on page, scroll depth, social shares, and click-through rate. These metrics provide valuable insights into how users are interacting with content and can help identify areas for improvement.
How can content engagement analytics be used to improve content strategy?
Content engagement analytics can be used to identify high-performing content, understand user preferences, and optimize content for better engagement. By analyzing these metrics, businesses can create more targeted and relevant content that resonates with their audience, leading to increased user engagement and conversions.
What are some popular tools for content engagement analytics?
Popular tools for content engagement analytics include Google Analytics, Adobe Analytics, Chartbeat, and Parse.ly. These tools provide a range of features for tracking and analyzing user engagement with online content, helping businesses make informed decisions about their content strategy.


0 Comments