


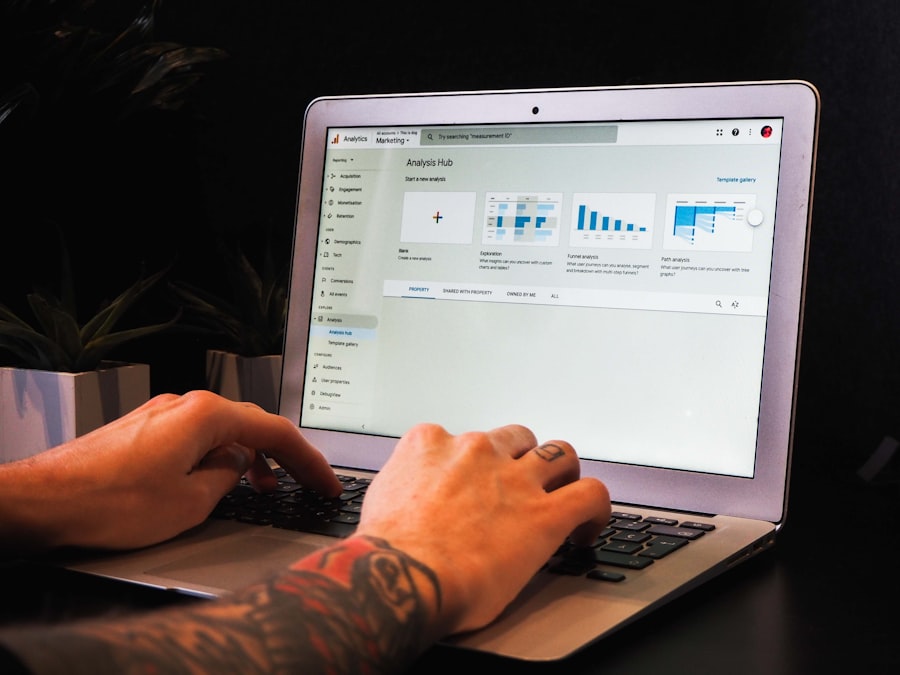
A content analytics dashboard is a powerful tool that aggregates data from various sources to provide insights into how your content is performing. It serves as a centralized hub where you can monitor key metrics, track user engagement, and evaluate the effectiveness of your content marketing efforts. By visualizing this data, you can make informed decisions that enhance your content strategy and ultimately drive better results.
The dashboard typically includes a range of metrics, from page views and time spent on page to social shares and conversion rates. Understanding how to navigate and interpret this information is crucial for any content marketer. It allows you to identify what resonates with your audience and what doesn’t, enabling you to refine your approach over time. In essence, a well-structured content analytics dashboard can be the difference between a hit and a miss in your content marketing campaigns.
Key Takeaways
- Content analytics dashboard provides valuable insights into the performance of content marketing efforts
- Key metrics and KPIs to track include website traffic, engagement, conversion rates, and social media metrics
- Data visualization and reporting tools help in presenting complex data in a clear and understandable manner
- Content analytics can be used to gain audience insights and tailor content to meet their needs and preferences
- Optimizing content performance involves analyzing data to identify what works and what doesn’t, and making necessary adjustments
Key Metrics and KPIs to Track
When it comes to content analytics, not all metrics are created equal. Focusing on the right key performance indicators (KPIs) is essential for gauging the success of your content. Some of the most important metrics to track include organic traffic, bounce rate, average session duration, and conversion rates. Each of these provides unique insights into how users interact with your content.
Organic traffic indicates how many visitors are coming to your site through search engines, which is a strong indicator of your SEO effectiveness. Bounce rate, on the other hand, tells you how many visitors leave your site after viewing only one page.
A high bounce rate may suggest that your content isn’t engaging enough or that it’s not meeting user expectations.
Average session duration gives you an idea of how long users are staying on your site, which can help you assess the quality of your content. Lastly, conversion rates measure how well your content drives users to take desired actions, such as signing up for a newsletter or making a purchase.
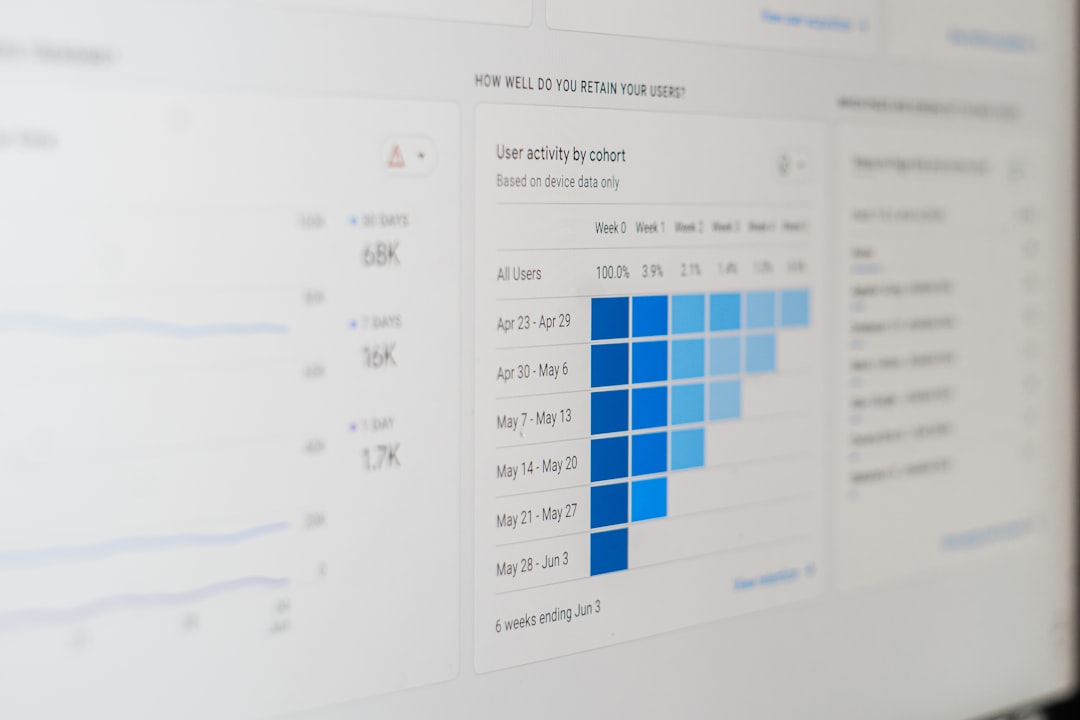
Data Visualization and Reporting

Data visualization plays a crucial role in making complex information more digestible.
A well-designed content analytics dashboard uses graphs, charts, and other visual elements to present data in an easily understandable format.
This not only helps you quickly grasp trends but also makes it easier to share insights with team members or stakeholders who may not be as data-savvy.
Reporting is another key aspect of content analytics. Regularly generating reports allows you to track progress over time and identify areas for improvement. These reports can be customized to focus on specific metrics or time frames, providing a clear picture of how your content is performing. By combining data visualization with effective reporting, you can create a compelling narrative around your content’s performance that informs future strategies.
Utilizing Content Analytics for Audience Insights
Understanding your audience is fundamental to creating effective content. Content analytics can provide valuable insights into who your audience is, what they like, and how they engage with your material. By analyzing demographic data, such as age, gender, and location, you can tailor your content to better meet the needs and preferences of your target audience.
Additionally, tracking user behavior on your site can reveal patterns in how different segments interact with your content. For instance, you might find that certain topics resonate more with specific demographics or that particular formats (like videos or infographics) lead to higher engagement rates. These insights can guide your content creation process, ensuring that you’re producing material that truly speaks to your audience.
Optimizing Content Performance
| Metrics | Value |
|---|---|
| Page Views | 10,000 |
| Unique Visitors | 5,000 |
| Time on Page | 2 minutes |
| Bounce Rate | 30% |
Once you have a clear understanding of how your content is performing, the next step is optimization. This involves making adjustments based on the data you’ve collected to improve overall performance. For example, if you notice that certain blog posts are driving significant traffic but have low conversion rates, it may be time to revisit those posts and enhance their calls-to-action or add more relevant links.
Another aspect of optimization is A/B testing different elements of your content. This could include experimenting with headlines, images, or even the layout of your pages. By systematically testing these variations, you can identify what works best for your audience and refine your approach accordingly. The goal is to create content that not only attracts visitors but also encourages them to engage and convert.
Tracking Engagement and Conversion Rates
Engagement metrics are critical for understanding how well your content resonates with users. These metrics include likes, shares, comments, and time spent on page. High engagement levels often indicate that your content is relevant and valuable to your audience. Conversely, low engagement may signal that it’s time to rethink your approach or explore new topics.
Conversion rates are equally important as they measure the effectiveness of your content in driving desired actions. Whether it’s signing up for a newsletter or making a purchase, tracking these rates helps you understand how well your content aligns with business goals. By analyzing both engagement and conversion metrics together, you can gain a comprehensive view of your content’s performance and make informed decisions about future strategies.
Leveraging Data for Content Strategy
Data-driven decision-making is at the heart of an effective content strategy. By leveraging insights from your analytics dashboard, you can identify gaps in your current strategy and explore new opportunities for growth. For instance, if data shows that certain topics are gaining traction in your industry but aren’t covered extensively on your site, this could be a chance to create new content that fills that void.
Moreover, understanding seasonal trends or shifts in audience behavior can help you plan your content calendar more effectively. If you notice spikes in interest around specific topics during certain times of the year, you can align your content production accordingly. This proactive approach ensures that you’re always delivering relevant material that meets the evolving needs of your audience.
Identifying Trends and Patterns
One of the most valuable aspects of content analytics is its ability to reveal trends and patterns over time. By regularly reviewing data from your dashboard, you can spot emerging topics or shifts in audience preferences that may not be immediately obvious. For example, if you notice an increase in searches related to sustainability within your industry, this could signal a growing interest that warrants further exploration in your content.
Identifying these trends allows you to stay ahead of the curve and position yourself as a thought leader in your field. Additionally, recognizing patterns in user behavior—such as peak engagement times or preferred content formats—can inform when and how you publish new material. This strategic approach helps ensure that you’re consistently meeting audience expectations while maximizing engagement.
Integrating Content Analytics with Other Tools
To get the most out of your content analytics efforts, consider integrating your dashboard with other tools in your marketing stack. For instance, connecting analytics with customer relationship management (CRM) software can provide deeper insights into how content influences customer journeys. This integration allows for a more holistic view of user interactions across various touchpoints.
Additionally, combining analytics with social media management tools can help track how well your content performs across different platforms. By analyzing social shares alongside website traffic data, you can gain insights into which channels drive the most engagement and conversions. This comprehensive approach enables you to refine both your content strategy and distribution tactics for maximum impact.
Best Practices for Using Content Analytics Dashboard
To effectively utilize a content analytics dashboard, it’s essential to follow some best practices. First and foremost, ensure that you’re regularly reviewing the data—weekly or monthly check-ins can help keep you informed about performance trends without becoming overwhelming. Setting specific goals for what you want to achieve with each review can also help focus your analysis.
Another best practice is to involve team members in the process. Sharing insights from the dashboard with colleagues can foster collaboration and generate new ideas for content creation or optimization. Additionally, consider documenting key findings and action items from each review session so that everyone stays aligned on goals and strategies moving forward.
Measuring ROI and Effectiveness of Content Marketing
Ultimately, measuring the return on investment (ROI) of your content marketing efforts is crucial for justifying budgets and resources. To do this effectively, start by defining what success looks like for your organization—whether it’s increased sales, lead generation, or brand awareness. Once you have clear objectives in place, use analytics data to track progress toward these goals.
Calculating ROI involves comparing the costs associated with creating and distributing content against the revenue generated from those efforts. This could include direct sales attributed to specific pieces of content or leads generated through forms on landing pages. By regularly assessing ROI alongside other performance metrics, you can make informed decisions about where to allocate resources for future campaigns.
In conclusion, mastering a content analytics dashboard is essential for any marketer looking to optimize their strategy effectively. By understanding key metrics, leveraging audience insights, and integrating data across tools, you can create compelling content that drives engagement and conversions while continuously improving performance over time.
FAQs
What is a content analytics dashboard?
A content analytics dashboard is a tool that provides insights and data on the performance of content across various digital platforms. It allows users to track metrics such as engagement, reach, and conversion rates to understand the effectiveness of their content marketing efforts.
What are the key features of a content analytics dashboard?
Key features of a content analytics dashboard include real-time data tracking, customizable reporting, social media integration, content performance comparison, and audience segmentation. These features help users to analyze and optimize their content strategy.
How can a content analytics dashboard benefit businesses?
A content analytics dashboard can benefit businesses by providing valuable insights into audience behavior, content performance, and ROI. It helps businesses to make data-driven decisions, improve content strategy, and optimize marketing efforts for better results.
What types of metrics can be tracked using a content analytics dashboard?
Metrics that can be tracked using a content analytics dashboard include website traffic, page views, bounce rates, time on page, social media engagement, conversion rates, click-through rates, and audience demographics. These metrics help in understanding the impact of content on the target audience.
What are some popular content analytics dashboard tools?
Some popular content analytics dashboard tools include Google Analytics, Adobe Analytics, SEMrush, Moz, and Sprout Social. These tools offer a range of features for tracking and analyzing content performance across different digital channels.


0 Comments