


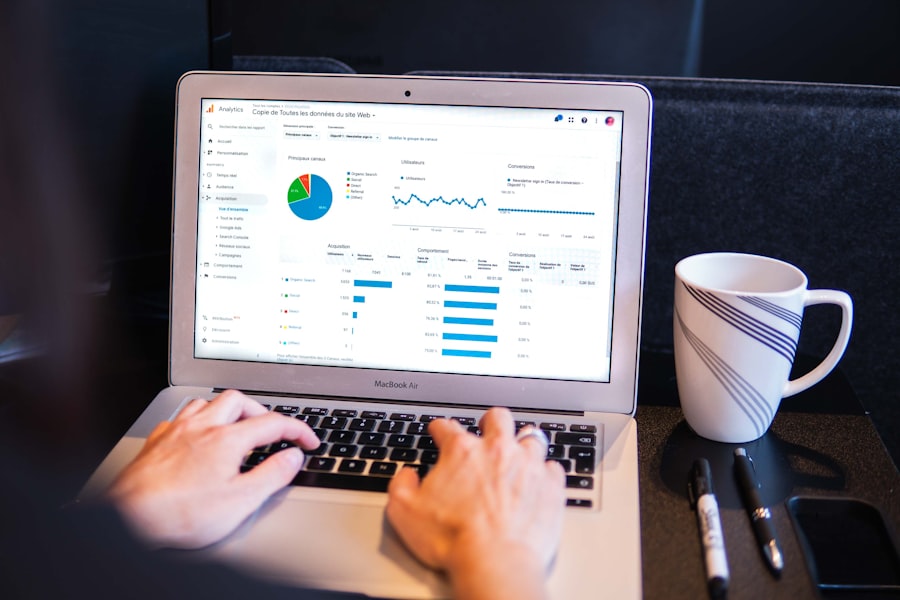
In today’s data-driven world, a client data visualization dashboard serves as a crucial tool for businesses looking to enhance their client management strategies. This dashboard aggregates various data points into a single, user-friendly interface, allowing organizations to monitor client interactions, preferences, and behaviors in real-time. By presenting complex data in a visually appealing format, these dashboards help teams make informed decisions quickly and efficiently.
The primary goal of a client data visualization dashboard is to simplify the interpretation of data. Instead of sifting through spreadsheets or lengthy reports, stakeholders can view key metrics at a glance. This not only saves time but also fosters a deeper understanding of client needs and trends, ultimately leading to improved service delivery and stronger client relationships.
Key Takeaways
- Client data visualization dashboards provide a visual representation of important client data for easy analysis and decision-making.
- Data visualization is crucial in client management as it helps in understanding complex data, identifying trends, and making informed decisions.
- Key features of an effective client data visualization dashboard include interactive charts, real-time data updates, customizable dashboards, and drill-down capabilities.
- When choosing data visualization tools for your dashboard, consider factors such as ease of use, integration with existing systems, and scalability.
- Best practices for designing and implementing a client data visualization dashboard include understanding user needs, using clear and concise visuals, and providing training and support for users.
The Importance of Data Visualization in Client Management
Data visualization plays a pivotal role in client management by transforming raw data into actionable insights. When businesses can visualize their data effectively, they can identify patterns and trends that might otherwise go unnoticed.
This capability is particularly important in understanding client behavior, preferences, and satisfaction levels, which are essential for tailoring services and improving overall client experience.
Moreover, effective data visualization enhances communication within teams. When everyone can see the same visual representation of data, it fosters collaboration and ensures that all team members are on the same page. This shared understanding is vital for aligning strategies and making collective decisions that benefit both the business and its clients.
Key Features of an Effective Client Data Visualization Dashboard

An effective client data visualization dashboard should include several key features to maximize its utility.
First and foremost, it should be user-friendly.
A clean, intuitive interface allows users to navigate the dashboard easily, ensuring that they can find the information they need without frustration. This is especially important for teams that may not have extensive technical expertise.
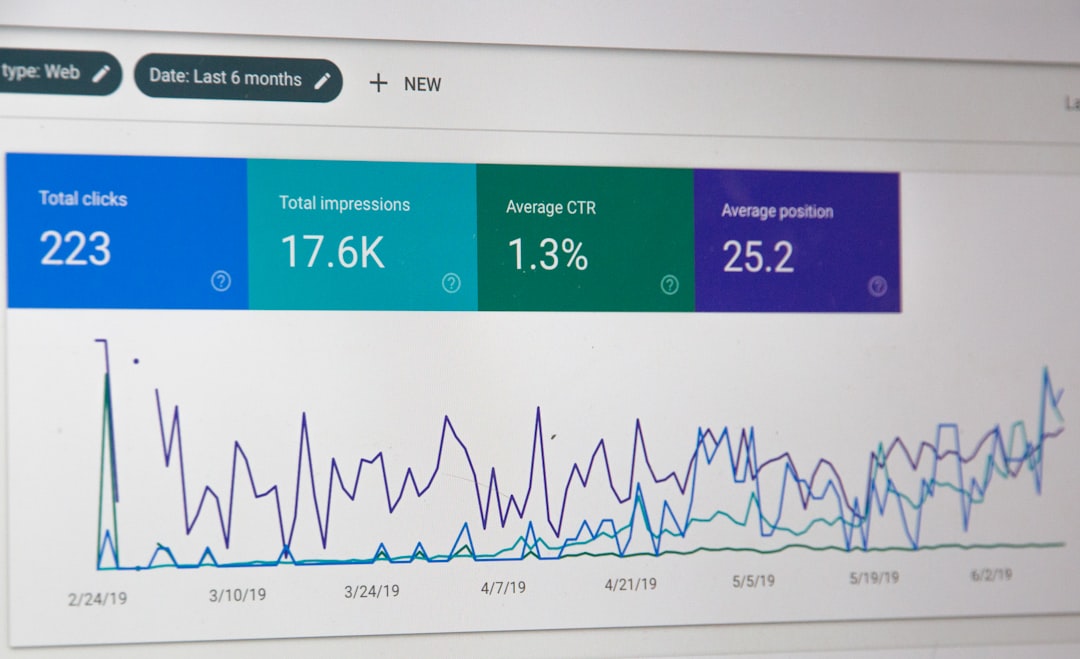
Another critical feature is real-time data updates. In a fast-paced business environment, having access to the most current information is essential for making timely decisions. Dashboards that refresh automatically or allow for manual updates ensure that users are always working with the latest data. Additionally, customizable views can enhance user experience by allowing team members to tailor the dashboard to their specific needs and preferences.
How to Choose the Right Data Visualization Tools for Your Dashboard
Selecting the right data visualization tools is crucial for building an effective client data visualization dashboard. Start by assessing your specific needs and objectives. Consider what types of data you will be visualizing and how you plan to use that information. Different tools offer various functionalities, so it’s important to choose one that aligns with your goals.
Next, evaluate the ease of use of potential tools. A steep learning curve can hinder adoption among team members, so look for platforms that offer user-friendly interfaces and robust support resources. Additionally, consider integration capabilities with your existing systems. A tool that seamlessly connects with your CRM or other databases will streamline your workflow and enhance the overall effectiveness of your dashboard.
Best Practices for Designing and Implementing a Client Data Visualization Dashboard
| Metrics | Current | Target |
|---|---|---|
| Number of active users | 500 | 1000 |
| Conversion rate | 25% | 30% |
| Page views | 10,000 | 15,000 |
| Engagement rate | 40% | 45% |
When designing a client data visualization dashboard, adhering to best practices can significantly enhance its effectiveness. Start with a clear layout that prioritizes the most important metrics. Use visual hierarchy to guide users’ attention to key insights first, ensuring that they can quickly grasp the information that matters most.
Incorporating interactive elements can also improve user engagement. Features like drill-down capabilities allow users to explore data in greater detail without overwhelming them with information upfront. Additionally, ensure that your color scheme is consistent and accessible; using contrasting colors can help differentiate between various data points while maintaining readability.
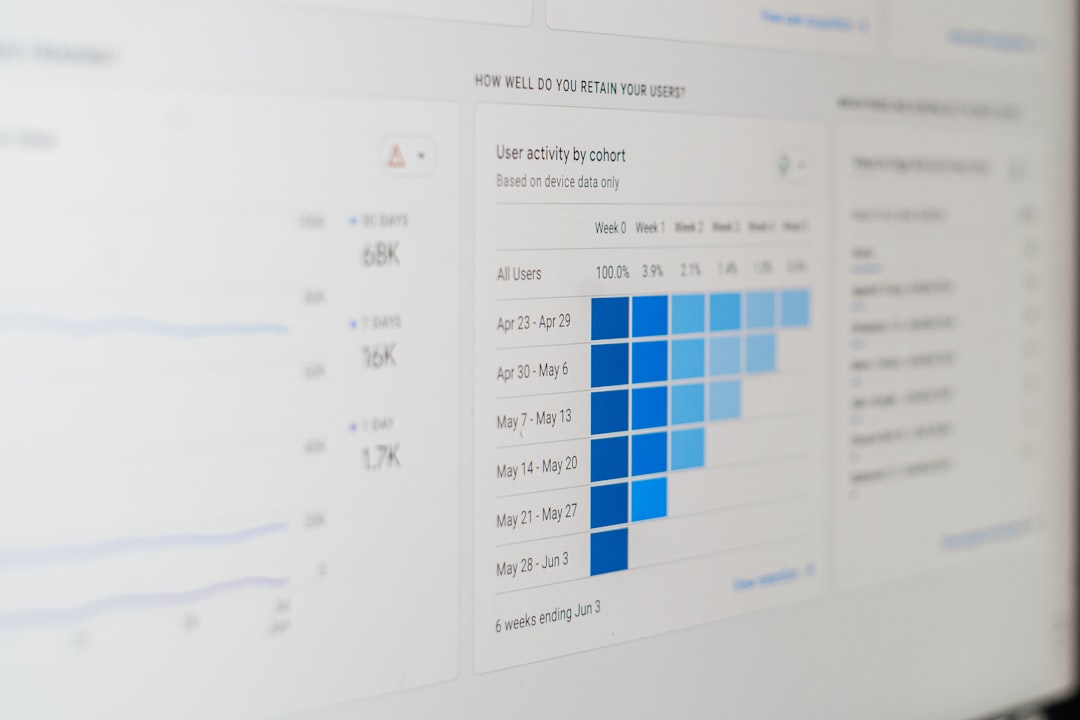
Using Client Data Visualization to Identify Trends and Patterns
One of the most powerful aspects of client data visualization is its ability to reveal trends and patterns over time. By analyzing historical data alongside current metrics, businesses can identify shifts in client behavior or preferences that may inform future strategies. For instance, if a particular service sees increased usage during specific months, this insight can guide marketing efforts or resource allocation.
Moreover, visualizing trends can help businesses anticipate client needs before they arise. By recognizing patterns in purchasing behavior or service requests, organizations can proactively adjust their offerings or communication strategies. This forward-thinking approach not only enhances client satisfaction but also positions businesses as responsive and attentive partners.
Enhancing Client Communication and Reporting with Data Visualization
Data visualization can significantly improve how businesses communicate with clients. Instead of presenting clients with dense reports filled with numbers and jargon, visual dashboards can convey complex information in an easily digestible format. This not only makes it easier for clients to understand their own data but also fosters transparency in the relationship.
Regularly sharing visual reports with clients can also strengthen trust and engagement. By showcasing key metrics and progress through visuals, businesses demonstrate their commitment to accountability and performance. This practice encourages open dialogue about results and areas for improvement, ultimately leading to more productive partnerships.
Leveraging Client Data Visualization for Decision Making and Strategy Development
Client data visualization is an invaluable asset for decision-making processes within organizations. When stakeholders have access to clear visual representations of data, they can make informed choices based on evidence rather than intuition alone. This analytical approach reduces the risk of errors and enhances the overall quality of strategic planning.
Furthermore, visualized data can facilitate scenario analysis, allowing teams to explore potential outcomes based on different variables. For example, by visualizing how changes in pricing might affect client retention rates, businesses can make more strategic decisions about pricing models or promotional offers. This level of insight empowers organizations to develop strategies that are not only reactive but also proactive.
Measuring the Impact of Client Data Visualization on Business Performance
To truly understand the value of a client data visualization dashboard, it’s essential to measure its impact on business performance. Start by establishing key performance indicators (KPIs) that align with your objectives. These could include metrics related to client satisfaction, retention rates, or revenue growth.
Once you have defined your KPIs, regularly assess how well your dashboard supports these goals. Are you seeing improvements in client engagement or satisfaction? Are decision-making processes becoming more efficient? Gathering feedback from team members who use the dashboard can also provide valuable insights into its effectiveness and areas for improvement.
Overcoming Challenges in Implementing a Client Data Visualization Dashboard
Implementing a client data visualization dashboard is not without its challenges. One common hurdle is resistance to change among team members who may be accustomed to traditional reporting methods. To address this issue, invest time in training sessions that highlight the benefits of the new system and demonstrate how it simplifies their work processes.
Another challenge is ensuring data accuracy and consistency across various sources. Inaccurate or outdated information can undermine the credibility of your dashboard. Establishing clear protocols for data entry and regular audits can help maintain high standards of data integrity, ensuring that users can trust the insights generated by the dashboard.
Future Trends in Client Data Visualization and Dashboard Development
As technology continues to evolve, so too will the landscape of client data visualization dashboards. One emerging trend is the integration of artificial intelligence (AI) and machine learning capabilities into these tools. By leveraging AI algorithms, dashboards can provide predictive analytics that help businesses anticipate client needs and behaviors more accurately.
Additionally, there’s a growing emphasis on mobile-friendly dashboards as remote work becomes more prevalent. Ensuring that dashboards are accessible on various devices will allow teams to stay connected and informed regardless of their location. As these trends develop, businesses will need to remain adaptable and open to new technologies that enhance their client management efforts through effective data visualization.
In conclusion, a well-designed client data visualization dashboard is an essential tool for modern businesses aiming to improve client management strategies. By understanding its importance, key features, best practices for implementation, and future trends, organizations can harness the power of data visualization to drive better decision-making and foster stronger relationships with their clients.
FAQs
What is a client data visualization dashboard?
A client data visualization dashboard is a tool that allows businesses to display and analyze their client data in a visual format, such as charts, graphs, and other visual representations. It provides a comprehensive view of client-related metrics and key performance indicators.
What are the benefits of using a client data visualization dashboard?
Using a client data visualization dashboard can help businesses gain insights into client behavior, preferences, and trends. It can also aid in making data-driven decisions, identifying opportunities for growth, and improving client satisfaction and retention.
What types of client data can be visualized in a dashboard?
A client data visualization dashboard can display various types of client data, including sales performance, customer demographics, purchase history, website traffic, social media engagement, and customer feedback. It can also integrate data from multiple sources for a comprehensive view.
How can a client data visualization dashboard be customized?
A client data visualization dashboard can be customized to display specific metrics and KPIs that are relevant to a business’s client management goals. Users can choose different visualization formats, apply filters, and create custom dashboards for different client segments or business units.
What are some popular tools for creating client data visualization dashboards?
Popular tools for creating client data visualization dashboards include Tableau, Power BI, Google Data Studio, and Domo. These tools offer a range of features for data integration, visualization, and analysis, and can be tailored to meet specific business needs.


0 Comments