


Website user behavior analysis is a crucial aspect of understanding how visitors interact with your site. By examining user behavior, you can gain insights into what works well and what doesn’t, allowing you to make informed decisions that enhance user experience and drive conversions. Essentially, it’s about observing the paths users take, the content they engage with, and the actions they complete—or fail to complete—on your website.
In today’s digital landscape, where competition is fierce and attention spans are short, understanding user behavior can set you apart. It’s not just about having a visually appealing website; it’s about creating an experience that resonates with your audience. By analyzing user behavior, you can tailor your content and design to meet the needs and preferences of your visitors, ultimately leading to better engagement and higher conversion rates.
Key Takeaways
- Website user behavior analysis helps in understanding how users interact with a website.
- Monitoring tools are important for tracking and analyzing user behavior and website performance.
- Choose monitoring tools that align with your specific website goals and objectives.
- Setting up monitoring tools and collecting data is crucial for gaining insights into user behavior patterns and trends.
- Utilize heatmaps, click tracking, and conversion rate tracking to improve user engagement and website performance.
Understanding the Importance of Monitoring Tools
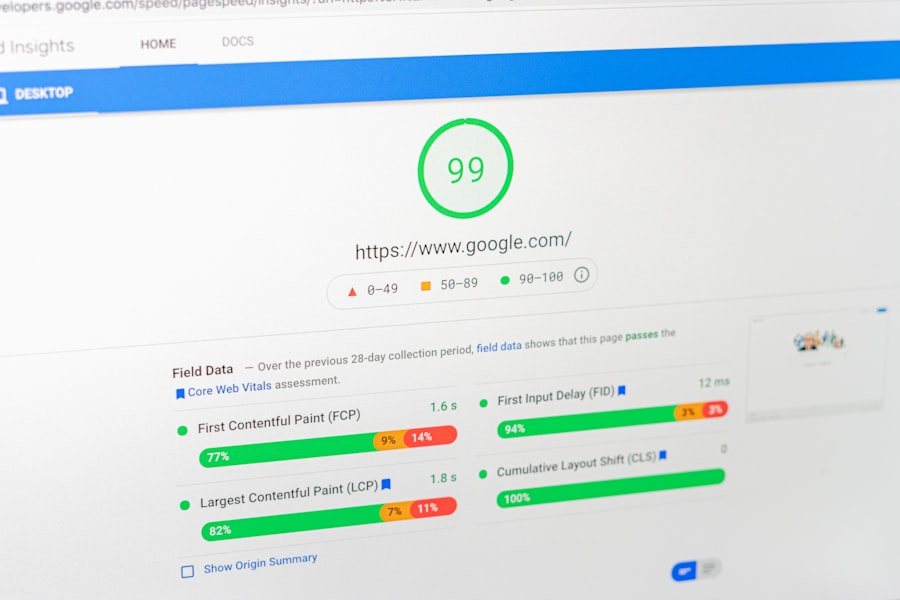
Monitoring tools are essential for gathering data on user behavior. They provide the means to track various metrics, from page views to click-through rates, giving you a comprehensive view of how users interact with your site. Without these tools, you’re essentially flying blind; you might have a gut feeling about what’s working, but without data, it’s hard to make informed decisions.
Moreover, monitoring tools help you identify trends over time. For instance, if you notice a sudden drop in traffic or engagement on a specific page, these tools can help pinpoint the issue. They allow you to track changes in user behavior in response to updates or new content, enabling you to adapt quickly and effectively. In short, monitoring tools are not just helpful; they’re indispensable for anyone serious about optimizing their website.
Choosing the Right Monitoring Tools for Your Website
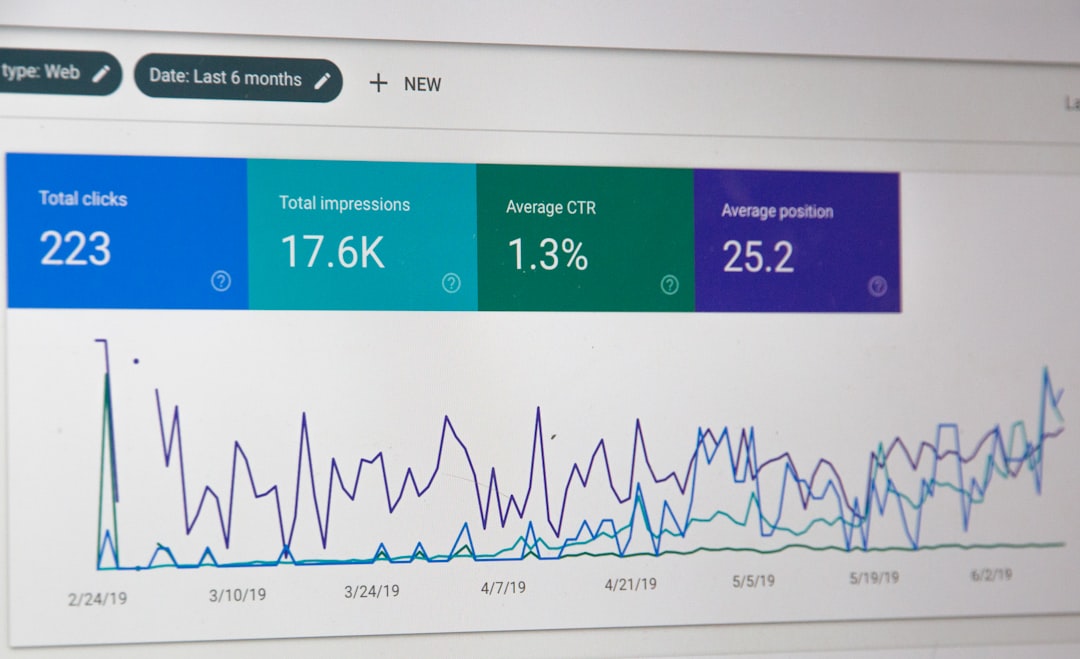
When it comes to selecting monitoring tools, there are numerous options available, each with its own strengths and weaknesses. Google Analytics is often the go-to choice for many website owners due to its robust features and free access. It provides a wealth of information about user demographics, traffic sources, and behavior flow, making it a solid starting point for most businesses.
However, depending on your specific needs, you might want to explore other tools as well. For example, if you’re particularly interested in user engagement metrics, tools like Hotjar or Crazy Egg offer heatmaps and session recordings that can provide deeper insights into how users interact with your site. It’s important to assess what metrics matter most to your business and choose tools that align with those goals. A combination of tools may also be beneficial, allowing you to gather a more comprehensive set of data.
Setting Up Monitoring Tools and Collecting Data

Once you’ve chosen your monitoring tools, the next step is setting them up correctly. This process typically involves adding tracking codes to your website’s codebase. For Google Analytics, this means inserting a snippet of JavaScript into the header of your site. While this may sound technical, most platforms offer straightforward guides to help you through the process.
After installation, it’s time to start collecting data. Initially, it may take some time for the tools to gather enough information for meaningful analysis. During this period, it’s wise to familiarize yourself with the dashboards and reports available in your chosen tools. Understanding how to navigate these interfaces will make it easier to extract valuable insights once sufficient data has been collected.
Analyzing User Behavior Patterns and Trends
“`html
| Metrics | Description |
|---|---|
| Page Views | The total number of times a page has been viewed by users. |
| Unique Visitors | The number of distinct individuals visiting the website within a specified time period. |
| Time on Page | The average amount of time users spend on a specific page. |
| Bounce Rate | The percentage of visitors who navigate away from the site after viewing only one page. |
| Conversion Rate | The percentage of visitors who take a desired action, such as making a purchase or signing up for a newsletter. |
“`
With data flowing in from your monitoring tools, the next step is analysis. This involves looking for patterns in user behavior that can inform your website strategy. For instance, you might notice that users tend to spend more time on certain pages or that they frequently drop off at a specific point in the conversion funnel.
Identifying these patterns can help you make data-driven decisions about content placement, design changes, or even marketing strategies.
For example, if users are consistently leaving your site after viewing a particular product page, it may indicate that the page needs optimization or that there’s an issue with the product itself.
By analyzing these trends over time, you can adapt your approach and improve overall user experience.
Identifying Key Metrics for Website Performance
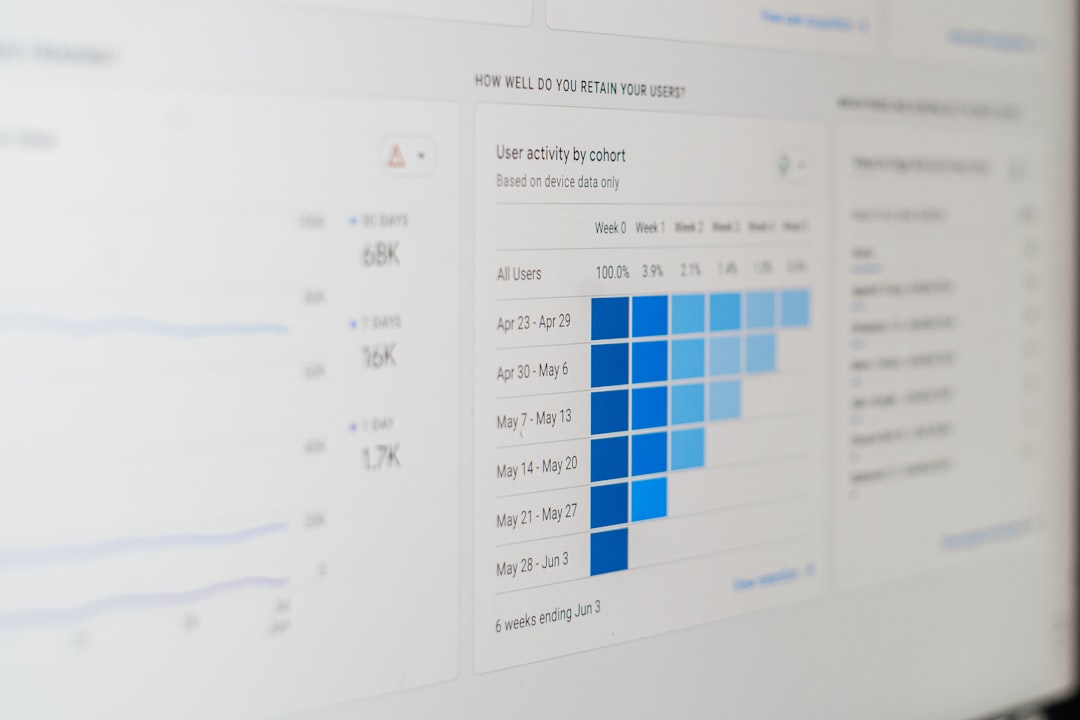
To effectively analyze user behavior, it’s essential to identify key performance metrics that align with your business goals. Common metrics include bounce rate, average session duration, pages per session, and conversion rate. Each of these metrics provides insight into different aspects of user engagement and site performance.
For instance, a high bounce rate may suggest that users aren’t finding what they expected when they land on your site. Conversely, a high average session duration could indicate that visitors are engaged with your content. By focusing on these key metrics, you can prioritize areas for improvement and track progress over time.
Utilizing Heatmaps and Click Tracking for User Engagement
Heatmaps and click tracking are powerful tools for visualizing user engagement on your website. Heatmaps show where users click most frequently on a page, providing insight into which elements attract attention and which are ignored. This information can be invaluable when designing or redesigning pages.
Click tracking takes this a step further by allowing you to see how users navigate through your site.
By understanding their journey—from landing pages to conversion points—you can identify areas where users may be getting stuck or losing interest.
This data can inform design changes that enhance usability and encourage users to take desired actions.
Tracking Conversion Rates and Funnel Analysis
Conversion rates are one of the most critical metrics for any website aiming to achieve specific goals, whether that’s sales, sign-ups, or downloads. Tracking conversion rates allows you to measure how effectively your site turns visitors into customers or leads. A thorough analysis of your conversion funnel can reveal where users drop off in the process.
Funnel analysis involves mapping out each step of the conversion process and identifying where potential customers abandon their journey. For example, if many users add items to their cart but fail to complete the purchase, it may indicate issues with the checkout process or unexpected costs like shipping fees. By addressing these bottlenecks, you can improve conversion rates and ultimately drive more revenue.
Identifying User Drop-off Points and Bottlenecks
Understanding where users drop off is crucial for optimizing your website’s performance. Drop-off points are areas in the user journey where visitors leave without completing their intended action. Identifying these points allows you to investigate potential issues that may be causing frustration or confusion.
Bottlenecks often occur during critical stages of the user journey—such as filling out forms or navigating through checkout processes. By analyzing user behavior at these points, you can pinpoint specific problems and implement solutions that streamline the experience. This might involve simplifying forms, improving loading times, or providing clearer instructions.
Implementing A/B Testing and User Experience Optimization
A/B testing is an effective method for optimizing user experience based on data-driven insights. This technique involves creating two versions of a webpage—Version A and Version B—and testing them against each other to see which performs better in terms of user engagement or conversions.
For example, you might test different headlines, images, or call-to-action buttons to determine which version resonates more with your audience. The results of A/B tests can provide valuable insights into user preferences and behaviors, allowing you to make informed decisions about design changes that enhance overall user experience.
Using Monitoring Tools to Improve Website Performance and User Experience
Ultimately, the goal of monitoring tools is to improve both website performance and user experience. By continuously analyzing data and making adjustments based on insights gained from user behavior analysis, you can create a more engaging and effective website.
Regularly reviewing key metrics and trends will help you stay ahead of potential issues before they escalate. Additionally, leveraging tools like heatmaps and A/B testing will enable you to refine your approach continually. In this way, monitoring tools become not just a means of tracking performance but a vital part of an ongoing strategy for growth and improvement in the digital space.
In conclusion, understanding website user behavior through analysis is not just beneficial; it’s essential for any business looking to thrive online. By utilizing monitoring tools effectively and focusing on key metrics, you can create a website that not only attracts visitors but also converts them into loyal customers.
FAQs
What is website user behavior monitoring?
Website user behavior monitoring is the process of tracking and analyzing how visitors interact with a website. This includes tracking actions such as page views, clicks, scrolling, and form submissions.
Why is it important to monitor website user behavior?
Monitoring website user behavior is important because it provides valuable insights into how visitors are engaging with a website. This data can be used to make informed decisions about website design, content, and marketing strategies to improve user experience and ultimately drive conversions.
What are some common tools used to monitor website user behavior?
Common tools used to monitor website user behavior include Google Analytics, Hotjar, Crazy Egg, and Mouseflow. These tools offer features such as heatmaps, session recordings, and user flow analysis to track and analyze user behavior.
What are the benefits of monitoring website user behavior?
Some benefits of monitoring website user behavior include gaining a better understanding of user preferences and behaviors, identifying areas for website improvement, optimizing conversion rates, and enhancing overall user experience.
How can website user behavior monitoring impact business success?
Website user behavior monitoring can impact business success by providing insights that can be used to make data-driven decisions to improve website performance, increase customer engagement, and ultimately drive more conversions and revenue.


0 Comments