


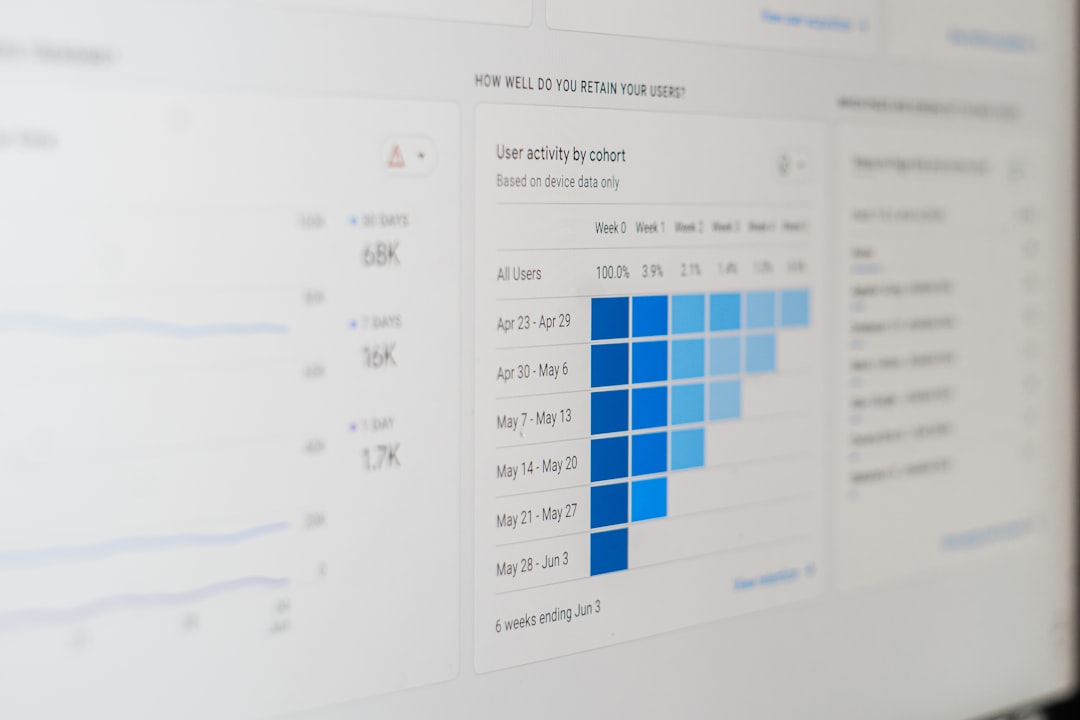
In the realm of e-commerce, understanding user behavior is crucial for optimizing the shopping experience and driving sales. Analytics tools provide valuable insights into how users interact with a website, revealing patterns and preferences that can inform strategic decisions.
By analyzing metrics such as page views, session duration, and bounce rates, businesses can gain a clearer picture of user engagement.
This data allows companies to identify which areas of their site are performing well and which may require improvement.
Moreover, user behavior analytics can help businesses segment their audience based on various criteria, such as demographics or purchasing habits. This segmentation enables targeted marketing efforts and personalized experiences, ultimately leading to higher conversion rates. By continuously monitoring user behavior, companies can adapt their strategies in real-time, ensuring they remain responsive to changing consumer needs and preferences.
Key Takeaways
- Use analytics tools to gain deep insights into user behavior and preferences.
- Implement heatmaps and click tracking to identify areas of high engagement and friction.
- Conduct A/B testing and analyze conversion funnels to optimize user flow and reduce drop-offs.
- Personalize the shopping experience and retarget abandoned carts to boost conversions.
- Continuously monitor KPIs and leverage customer feedback to enhance overall ecommerce UX.
Utilizing Heatmaps and Click Tracking for Insight
Heatmaps and click tracking are powerful tools that provide visual representations of user interactions on a website. Heatmaps display areas of a page that receive the most attention, indicating where users are clicking, scrolling, or hovering. This information is invaluable for understanding which elements of a webpage are engaging users and which are being overlooked. By analyzing heatmaps, businesses can make informed decisions about layout changes, content placement, and design adjustments to enhance user engagement.
Click tracking complements heatmaps by offering detailed insights into user navigation paths. It allows businesses to see how users move through their site, identifying common routes taken to reach specific pages or products. This data can highlight potential obstacles in the user journey, such as confusing navigation or poorly placed calls to action.
By addressing these issues, companies can streamline the user experience and increase the likelihood of conversions.
Analyzing Conversion Funnels to Identify Drop-off Points

Conversion funnels are essential for understanding the customer journey from initial interest to final purchase. By mapping out each stage of the funnel, businesses can identify where users drop off and why. Analyzing conversion funnels involves examining metrics such as abandonment rates at each stage, which can reveal critical insights into user behavior. For instance, if a significant number of users abandon their carts during the checkout process, it may indicate issues with payment options or shipping costs.
Identifying drop-off points allows businesses to implement targeted strategies to address these challenges. For example, simplifying the checkout process or offering incentives like free shipping can help reduce abandonment rates. Additionally, understanding the reasons behind drop-offs can inform broader marketing strategies, ensuring that messaging aligns with user expectations and needs throughout the purchasing journey.
A/B Testing for Continuous Improvement

A/B testing is a method used to compare two versions of a webpage or element to determine which performs better in terms of user engagement and conversions. By randomly directing a portion of users to each version, businesses can gather data on how changes impact user behavior. This approach allows for data-driven decision-making rather than relying on assumptions or gut feelings about what might work best.
The continuous nature of A/B testing means that businesses can iteratively improve their websites over time. For instance, testing different headlines, images, or call-to-action buttons can reveal which variations resonate more with users. The insights gained from A/B testing not only enhance individual elements but also contribute to a broader understanding of user preferences and behaviors, ultimately leading to a more effective overall strategy.
Leveraging Customer Journey Mapping for Enhanced UX
| Metric | Description | Importance | Typical Range | Actionable Insight |
|---|---|---|---|---|
| Conversion Rate | Percentage of visitors who complete a purchase | High | 1% – 5% | Optimize checkout flow and reduce friction points |
| Cart Abandonment Rate | Percentage of users who add items to cart but do not purchase | High | 60% – 80% | Improve cart usability and send reminder emails |
| Average Session Duration | Average time users spend on the site per visit | Medium | 2 – 5 minutes | Enhance content engagement and navigation |
| Page Load Time | Time taken for pages to fully load | High | Under 3 seconds | Optimize images and server response times |
| Click-Through Rate (CTR) | Percentage of users clicking on a specific link or button | Medium | 2% – 10% | Test button placement and call-to-action wording |
| Bounce Rate | Percentage of visitors who leave after viewing one page | High | 20% – 40% | Improve landing page relevance and load speed |
| Repeat Purchase Rate | Percentage of customers who make more than one purchase | Medium | 20% – 40% | Implement loyalty programs and personalized offers |
| Heatmap Engagement | Visual representation of where users click and scroll | Medium | N/A | Identify popular and ignored areas to optimize layout |
Customer journey mapping is a strategic approach that visualizes the entire experience a customer has with a brand, from initial awareness to post-purchase interactions. By mapping out each touchpoint along the journey, businesses can identify pain points and opportunities for improvement. This holistic view enables companies to understand how users perceive their brand and where enhancements can be made to create a more seamless experience.
Effective customer journey mapping involves gathering data from various sources, including analytics, surveys, and customer feedback. This comprehensive approach ensures that all aspects of the user experience are considered. By addressing identified pain points and optimizing key touchpoints, businesses can enhance overall user satisfaction and loyalty, ultimately driving repeat purchases and positive word-of-mouth.
Personalizing the Shopping Experience with Data
Personalization has become a key factor in e-commerce success, as consumers increasingly expect tailored experiences that cater to their individual preferences. By leveraging data collected from user interactions, businesses can create personalized shopping experiences that resonate with customers. This may include recommending products based on past purchases or browsing history or sending targeted email campaigns featuring items aligned with user interests.
Data-driven personalization not only enhances the shopping experience but also fosters customer loyalty. When users feel understood and valued through personalized interactions, they are more likely to return for future purchases. Additionally, personalization can lead to higher conversion rates as customers are presented with relevant options that meet their needs at the right time.
Monitoring Cart Abandonment and Retargeting Strategies
Cart abandonment is a common challenge in e-commerce, with many users adding items to their carts but failing to complete the purchase. Monitoring cart abandonment rates is essential for identifying trends and understanding potential reasons behind this behavior. Factors such as unexpected shipping costs or complicated checkout processes often contribute to abandonment rates.
To combat cart abandonment, businesses can implement retargeting strategies that remind users of their abandoned carts through targeted ads or email reminders. These strategies serve as gentle nudges that encourage users to return and complete their purchases. Additionally, offering incentives such as discounts or free shipping on abandoned carts can further entice users to finalize their transactions.
Optimizing Mobile Experience through Analytics
With the increasing prevalence of mobile shopping, optimizing the mobile experience is critical for e-commerce success. Analytics tools provide insights into how users interact with mobile sites or apps, revealing areas that may require improvement. Metrics such as load times, navigation ease, and mobile-specific conversion rates are essential for assessing mobile performance.
By analyzing mobile user behavior, businesses can make informed decisions about design adjustments and functionality enhancements. For instance, simplifying navigation menus or ensuring fast load times can significantly improve the mobile shopping experience. As more consumers turn to mobile devices for shopping, prioritizing mobile optimization will be key to capturing this growing market segment.
Improving Site Search and Navigation with Data
Effective site search and navigation are vital components of a positive user experience in e-commerce. Users should be able to find products quickly and easily without frustration. Analyzing search data can reveal common queries and search terms that lead users to specific products or categories. This information allows businesses to optimize their search functionality by ensuring relevant results are displayed prominently.
Additionally, examining navigation paths can help identify areas where users may struggle to find what they need. If analytics show high exit rates from certain pages or categories, it may indicate that navigation is unclear or that users are not finding relevant content. By refining site search capabilities and improving navigation structures based on data insights, businesses can enhance overall usability and drive higher conversion rates.
Utilizing Customer Feedback for UX Enhancements
Customer feedback is an invaluable resource for improving user experience (UX) in e-commerce. Gathering feedback through surveys, reviews, or direct communication provides insights into customer perceptions and experiences with a brand’s website or products. This information can highlight areas for improvement that may not be evident through analytics alone.
Acting on customer feedback demonstrates a commitment to enhancing the user experience and addressing concerns directly. For example, if multiple customers report difficulties with a specific feature or aspect of the site, businesses can prioritize those issues for resolution. By continuously seeking and incorporating customer feedback into UX strategies, companies can foster stronger relationships with their audience while creating a more satisfying shopping experience.
Measuring and Tracking Key Performance Indicators (KPIs) for Ecommerce Success
Measuring and tracking key performance indicators (KPIs) is essential for assessing the effectiveness of e-commerce strategies and initiatives. KPIs provide quantifiable metrics that reflect business performance in various areas such as sales growth, conversion rates, customer acquisition costs, and average order value. By regularly monitoring these indicators, businesses can gauge their progress toward achieving specific goals.
Establishing clear KPIs allows companies to make data-driven decisions based on performance trends over time. For instance, if conversion rates decline despite increased traffic, it may prompt an investigation into potential issues within the sales funnel or website usability. By aligning KPIs with overall business objectives and continuously analyzing performance data, e-commerce businesses can adapt their strategies effectively to drive growth and success in a competitive landscape.
FAQs
What is ecommerce UX analytics?
Ecommerce UX analytics refers to the process of collecting and analyzing data related to user interactions and behaviors on an online store. This helps businesses understand how customers navigate their website, identify pain points, and optimize the user experience to increase conversions and sales.
Why is UX analytics important for ecommerce websites?
UX analytics is important because it provides insights into customer behavior, preferences, and obstacles they face while shopping online. By understanding these factors, ecommerce businesses can improve website design, streamline the purchasing process, and enhance overall customer satisfaction, leading to higher retention and revenue.
What types of data are typically collected in ecommerce UX analytics?
Common data collected includes click patterns, page views, session duration, bounce rates, conversion rates, heatmaps, scroll depth, and user journey paths. This data helps identify which parts of the website are performing well and which areas need improvement.
Which tools are commonly used for ecommerce UX analytics?
Popular tools for ecommerce UX analytics include Google Analytics, Hotjar, Crazy Egg, Mixpanel, and Adobe Analytics. These platforms offer features like heatmaps, session recordings, funnel analysis, and real-time user tracking to provide comprehensive insights.
How can ecommerce businesses use UX analytics to improve sales?
By analyzing UX data, businesses can identify and fix usability issues, optimize product pages, simplify checkout processes, personalize user experiences, and test different design elements. These improvements reduce friction, increase customer engagement, and ultimately boost conversion rates and sales.


0 Comments